
Insights
Japan Car Export Statistics 2026: September Value Rises 15.1% as Volume Dips

Japan's Ministry of Finance has released provisional customs statistics for September 2026 showing motor vehicle exports of 510,555 units, down 0.5% from a year earlier, while the value of those exports climbed 15.1% to ¥1,719,107 million. Cars alone made up 15.7% of Japan's total goods exports that month and added 2.4 percentage points to overall export growth.
The gap between a falling unit count and a rising yen value is the story of the month. A weaker yen against the dollar, combined with a national export volume index that grew only 1.9%, means Japan shipped roughly the same number of vehicles as a year earlier but earned considerably more yen for doing so. For exporters and importers who buy Japanese stock in dollars or other foreign currency, this matters as much as the headline unit figures.
Data note: Figures for September 2026 and the April–September first half of fiscal 2026 are provisional Ministry of Finance statistics and may be revised. Used-vehicle export figures from JUMVEA cover January–August 2026 year to date, the most recent period available at the time of writing.
September 2026 At A Glance: Units Down 0.5%, Value Up 15.1%
The September result sits within a broader export expansion. Japan's total goods exports rose 16.7% year on year to ¥10,972,254 million, and cars alone contributed 2.4 percentage points to that growth, a sizeable share for a single product group. Within the vehicle category itself, cars dominate both unit count and value, so the sector's overall growth and decline figures largely track passenger car performance rather than buses and trucks, which make up a much smaller share of shipments.

Why Value Outran Volume: A ¥157 Yen and Rising Unit Prices
The single largest factor behind the value-volume gap was the exchange rate. The average customs rate for September 2026 was ¥157.43 to the dollar, 6.7% weaker than the ¥147.61 recorded a year earlier. A weaker yen raises the yen value of vehicles sold overseas without any change in the number of units shipped, and that is largely what happened: Japan's overall export volume index rose only 1.9% in September while the unit value index rose 14.5%, and total export value rose 16.7% to ¥10,972,254 million.
Part of the US-bound increase also reflects a weak comparison base. Car export value to the United States fell 24.2% in September 2025, so the 31.0% rise recorded in September 2026 is measured against a depressed starting point rather than a fresh surge in shipments. A bilateral trade arrangement capping US tariffs on most Japanese goods at 15%, agreed the previous year in exchange for added Japanese investment commitments, remains in effect for the period covered by this data. Even so, September's 16.7% overall export growth fell short of a Bloomberg consensus forecast of 21.3% and of a separate Reuters-reported forecast of 20.1%, suggesting that price effects, not demand, are carrying much of the headline growth. Imports rose 18.9% to ¥11,508,812 million, leaving Japan with a trade deficit of ¥536,558 million for the month.
Passenger Cars Versus Buses and Trucks
Cars and commercial vehicles moved in different directions in September. Car exports were 446,125 units, up a marginal 0.2%, worth ¥1,544,884 million, up 16.5%. Bus and truck exports fell more sharply in unit terms, to 57,705 units, down 8.3%, though their value still rose 4.3% to ¥169,296 million. The pattern is consistent across both categories: fewer or flat unit shipments, higher yen value per unit, with cars showing the stronger price effect of the two.

Where Japanese Vehicles Went: U.S. and EU Up, Middle East and China Down
Destination data for September 2026 show a clear split between markets that grew and markets that contracted, both in units and in value.
| Destination | Units | Value (¥ million) |
|---|---|---|
| USA | 106,972 | 476,214 |
| EU | 57,251 | 236,792 |
| Asia | 76,184 | 213,059 |
| Middle East | 51,014 | 210,100 |
| Russia | 16,429 | 20,432 |
| China (of which, within Asia) | 7,366 | 37,378 |
| South Korea (of which, within Asia) | 5,272 | 24,465 |
| ASEAN (of which, within Asia) | 25,947 | 64,907 |
Source: Ministry of Finance / Japan Customs, Trade Statistics, September 2026 (provisional).
Car exports to the USA rose 6.3% in units and 31.0% in value to ¥476,214 million, the largest value gain of any major destination, helped by the weak year-earlier base described above. The EU posted the strongest unit growth, up 24.0% to 57,251 units, with value up 31.9% to ¥236,792 million.
The picture reverses sharply once the Middle East and China are considered. Car exports to the Middle East fell to 51,014 units, down 35.2%, and ¥210,100 million in value, down 13.1%; cars made up 58.8% of all Japanese exports to the region, so a decline of this size affects the region's total trade figures, not just the car category. Exports to China collapsed to 7,366 units, down 64.3%, and exports to Russia eased 7.3% to 16,429 units, though cars remain central to that relationship, accounting for 66.2% of Japan's exports to Russia.
June to September Trend and the April–September Half-Year
Looking across the months leading into September gives a fuller view of the pattern. June vehicle exports were 547,085 units (+6.0%) worth ¥1,827,643 million (+23.0%); July was 524,159 units (+0.7%) worth ¥1,787,218 million (+19.5%); August was 449,226 units (+6.3%) worth ¥1,383,304 million (+16.5%); and September, as above, was 510,555 units (-0.5%) worth ¥1,719,107 million (+15.1%). Value growth has been easing steadily since June's 23.0% peak, even as unit volumes have fluctuated between modest gains and a small September decline.
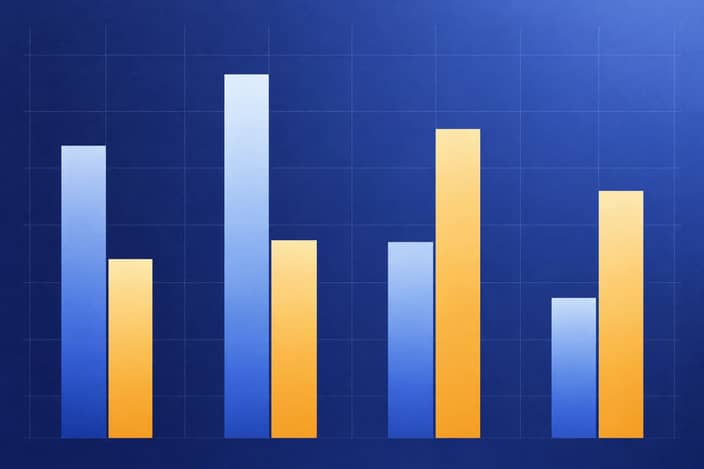
The broader national trade figures tell a similar story of decelerating but still-positive growth, with export value consistently outrunning export volume through the summer. Reuters characterised September as the 13th consecutive month of year-on-year export growth for Japan, even though the pace missed forecasts.
For the first half of fiscal 2026 (April–September), Japan's total exports reached ¥63,456,950 million, up 18.4% on the same period a year earlier. Car export value rose 15.2% over the half-year and added 2.4 percentage points to export growth, the second-largest contributor after semiconductors and electronic parts. Cumulative unit and yen figures for cars specifically were not broken out in the published summary.
Used Vehicle Exports: New Zealand Rising, UAE Collapsing
Japan's used-vehicle export market, tracked separately by JUMVEA for vehicles valued at ¥200,000 or more, shows a different set of winners and losers from the new-vehicle trade. Japan exported 144,447 used vehicles in August 2026, up 7.2% on August 2025, taking the January–August 2026 cumulative total to 1,137,821 units, up 2.7%.
| Destination | August 2026 (units) | Jan–Aug 2026 YTD (units) |
|---|---|---|
| Russia | 18,024 | 152,464 |
| Tanzania | 16,920 | 116,595 |
| Kenya | 7,525 | 51,272 |
| New Zealand | 7,294 | 62,140 |
| Chile | 6,987 | 59,966 |
| Mongolia | 6,117 | 56,694 |
| South Africa | 5,130 | 48,911 |
| Thailand | 4,878 | 33,030 |
| Sri Lanka | 2,763 | 47,126 |
| UAE | 2,418 | 46,501 |
Source: JUMVEA, via Japan Carrier, used vehicle export statistics, August 2026.
Russia remained the largest single destination in August at 18,024 units, up 18.7% year on year though down 24.4% on July, with a year-to-date total of 152,464 units, up 31.6%. New Zealand continued a steady climb, with August exports of 7,294 units up 16.9% and a year-to-date total of 62,140 units, up 26.6%.
The UAE stands out for the opposite reason. August exports of 2,418 units were only 12.8% of the August 2025 volume, dropping the UAE to 21st place among destinations; the year-to-date total of 46,501 units was just 27.6% of the prior-year period. The decline is not new: Japanese used-vehicle exports to the UAE fell 93.8% to 1,499 units as early as March 2026. Excluding the UAE from the totals, Japan's used-vehicle exports were actually up 22.6% in August and up 16.2% year to date, underlining how much a single market is distorting the aggregate figures.
What It Means for Buyers in Canada, New Zealand and the UAE
For Canada, the relevant constraint is regulatory rather than supply-driven. Vehicles manufactured more than 15 years ago are age-exempt from Motor Vehicle Safety Act requirements, with age based on month and year of manufacture, but being importable does not guarantee a vehicle can be licensed, since some provinces will not license right-hand-drive vehicles. Vehicles under 15 years old must qualify under the Registered Importer Vehicle program, which is limited to US- or Mexico-specification vehicles, or meet Canadian safety standards directly; Japanese domestic-market vehicles under 15 years old do not qualify under either route. Buyers sourcing from Japan for the Canadian market should treat the 15-year threshold, not the September trade figures, as the binding constraint on sourcing.
For New Zealand, used-vehicle exports have risen for several consecutive months and are up 26.6% year to date, indicating continuity of supply to the market, in contrast with the disruption visible in the UAE data.
For the UAE, the collapse in used-vehicle export volumes, down to roughly a quarter of the prior year's level year to date, represents a structural change in sourcing patterns from Japan rather than a one-month anomaly, given that the decline was already visible in March. This used-vehicle trend is a separate measure from the new-vehicle car export data for the broader Middle East region, where car exports fell 35.2% in September; the two figures cover different vehicle categories (used versus new) and different geographic scopes (a single country versus a regional grouping), and they should not be read as directly comparable.
Sources
- Ministry of Finance / Japan Customs — 令和8年9月分貿易統計(速報) (Trade Statistics, September 2026 provisional)
- Ministry of Finance / Japan Customs — Trade Statistics – Value of Exports and Imports September 2026 (Provisional)
- Ministry of Finance / Japan Customs — Trade Statistics – August 2026 (Provisional)
- Ministry of Finance / Japan Customs — Trade Statistics – July 2026 (Provisional)
- Ministry of Finance / Japan Customs — Trade Statistics – June 2026 (Provisional)
- Ministry of Finance / Japan Customs — 令和8年度上半期分貿易統計(速報)の概要 (FY2026 first-half summary)
- Ministry of Finance — Press Release – Trade Statistics of Japan
- Ministry of Finance (Japan Customs) — Trade Statistics of Japan, news page
- ATPAGES — 貿易統計9月、輸出16.7%増も数量は1.9%増どまり
- CNBC — Japan September exports rebound, after four straight months of declines
- The Japan Times (Bloomberg) — Japan's export growth stays solid, supported by chips and cars
- Reuters via Yahoo Finance — Japan September exports rise 16.7% y/y, slower than forecast
- Japan Carrier — 2026年8月 中古車輸出統計|144,447台、タンザニアがロシアに1,104台差
- iATA (International Auto Trade Association) — News Online
- Transport Canada — Importing Older Vehicles into Canada
- Canada Border Services Agency — Memorandum D19-12-1: Importing Vehicles into Canada
Last updated: October 2026. Figures for September 2026 and the April–September first half of fiscal 2026 are provisional and may be revised by the Ministry of Finance in subsequent releases.
Data Table
| Period | Export value | Export volume |
|---|---|---|
| Jan 2026 | 16.8 | 8.8 |
| Feb 2026 | 4.0 | -0.9 |
| Mar 2026 | 11.5 | 3.6 |
| Apr 2026 | 14.8 | 3.4 |
| May 2026 | 16.8 | 0.4 |
| Jun 2026 | 19.3 | 0.2 |
| Jul 2026 | 23.2 | 5.2 |
| Aug 2026 (provisional) | 19.3 | 2.5 |
Source: Ministry of Finance / Japan Customs, Trade Statistics of Japan – August 2026 (Provisional).